
Use dashboards
Arrange widgets to track key business metrics in one place.
Dashboards let you see your most important numbers at a glance. You can build your own view by adding widgets and arranging them how you like.
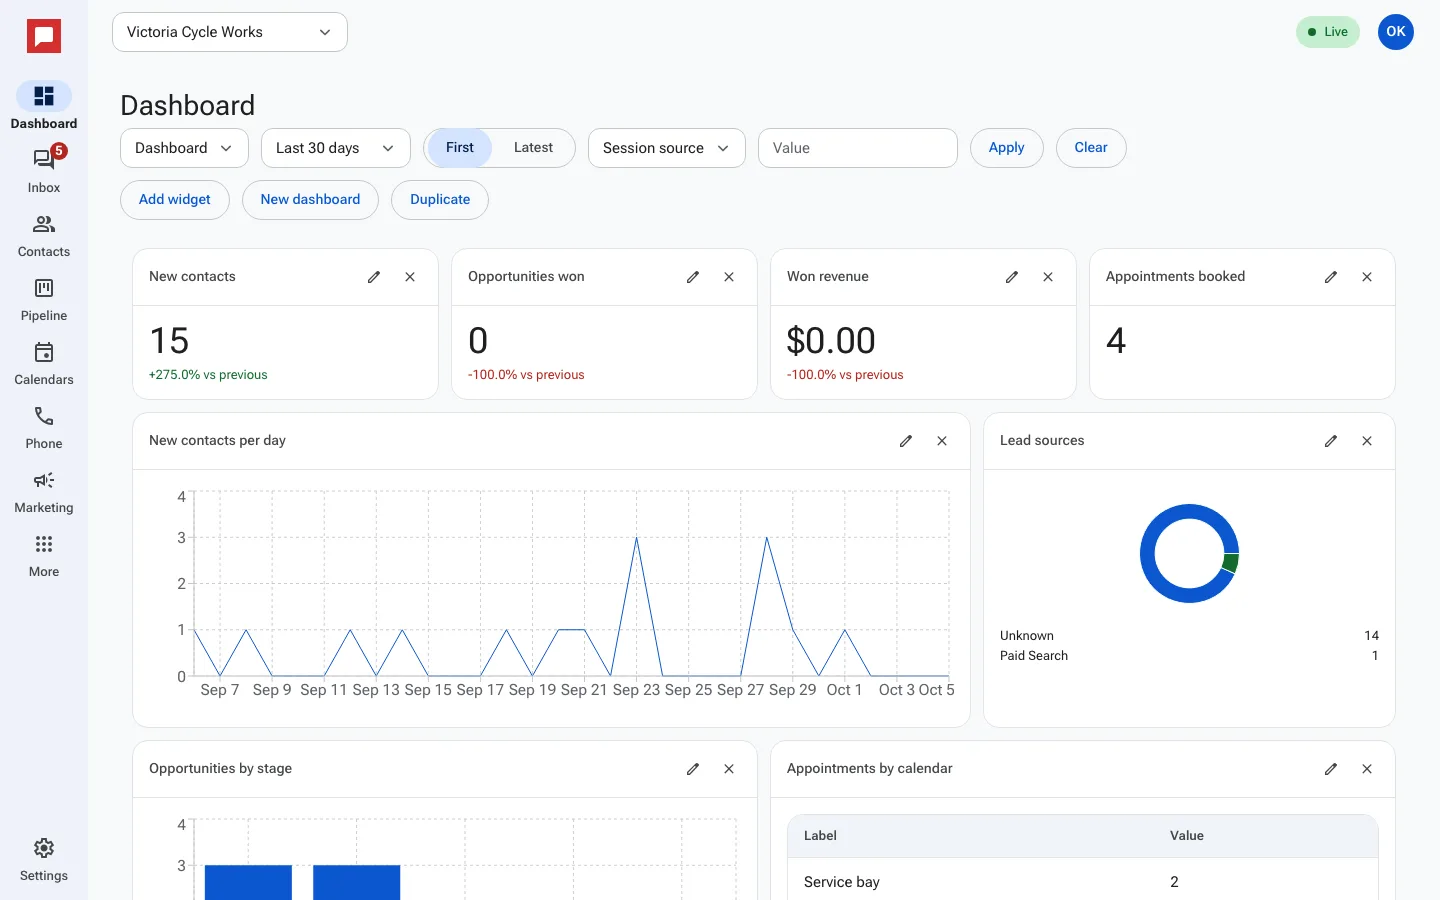
Steps
- Click Dashboard at the top of the left icon rail.
- Pick a dashboard from the menu at the top left, or make a new one.
- Click New dashboard to start a blank one, or Duplicate to copy the current one.
- Click Add widget to open the widget picker.
- Choose a widget type like Scorecard, Line chart, Bar chart, Donut, or Table.
- Select the metric you want to track, such as Leads or Won value (USD).
- Set the Date range for the widget.
- Drag the widget to a new position on the grid.
- Resize the widget by dragging its edges.
Good to know
- You can create multiple dashboards for different teams or goals.
- Widgets update based on the date range you select.
- You can filter widgets by attribution fields like Source or UTM campaign.
- Changes to the layout are saved automatically when you drop a widget.